March 19 2020
Mouth Mask Sales Volume Analysis from IXSPY
IXSPY for AliExpress is a great helper for analyzing your target products. Today we take mouth masks for example.
Rigid Demand of Products:
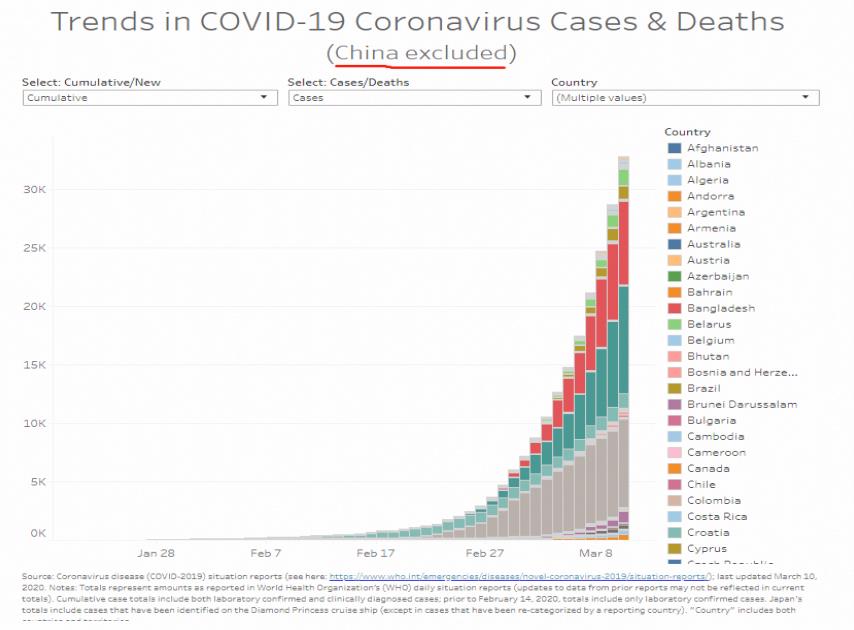
The widespread of COVID-19 greatly stimulates the demands of surgical or household protective products.
Pic: Trend in COVID-19 Cases & Death (China Excluded)
How to Track the Growth Trend of Products?
Hot Rankings of TOP 1, 000 Products (Before & After)
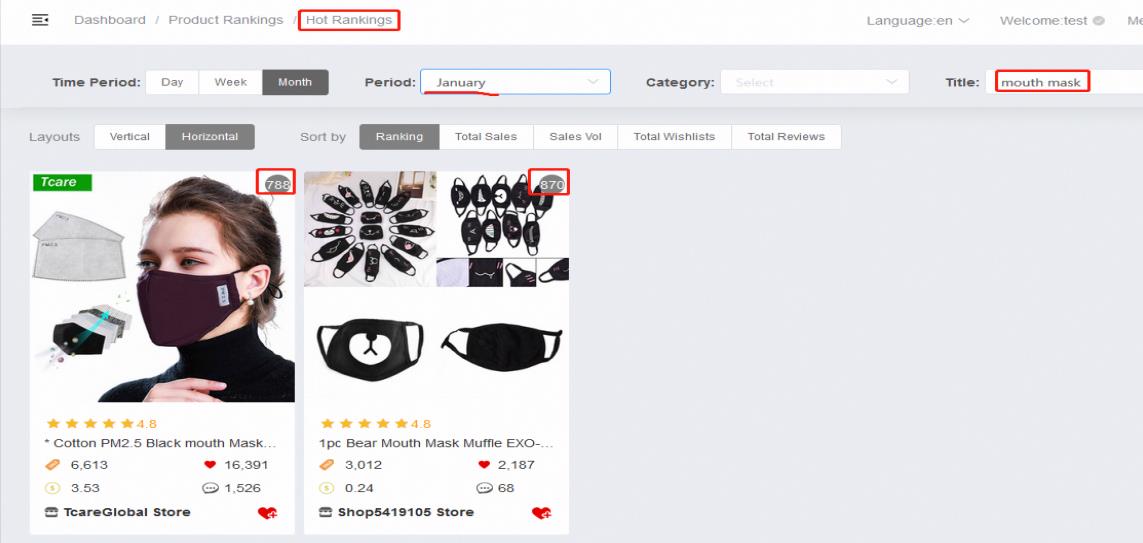
Before: Searching for the keyword 【mouth mask】, you will find only 2 products and these products rank 788th and 870th respectively in January Hot Rankings.
Pic: Monthly Hot Rankings of TOP 1, 000 products in January
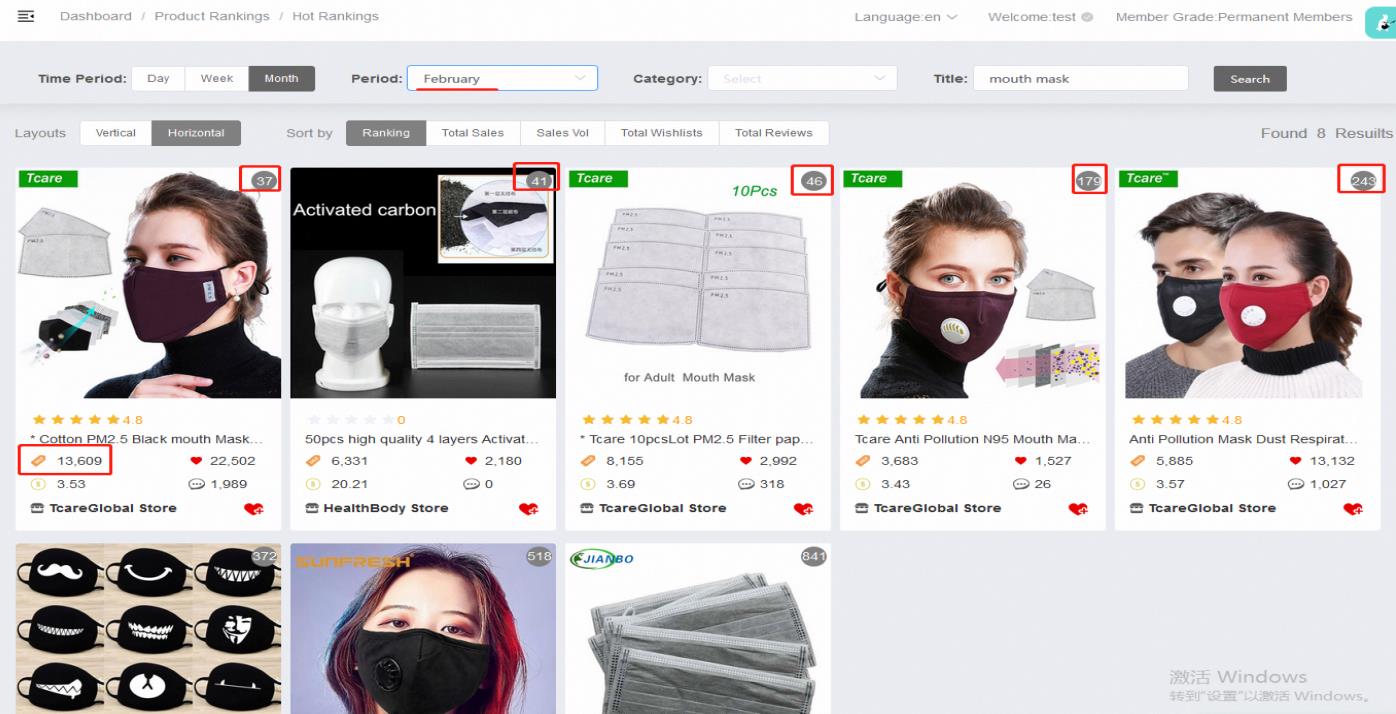
After: Within less than one month, 8 mouth masks are ranked in top 1, 000 Hot Rankings after searching for the same keyword, and the previous 788th product soars to the 37th place now.
Pic: Monthly Hot Rankings of TOP 1, 000 products in February
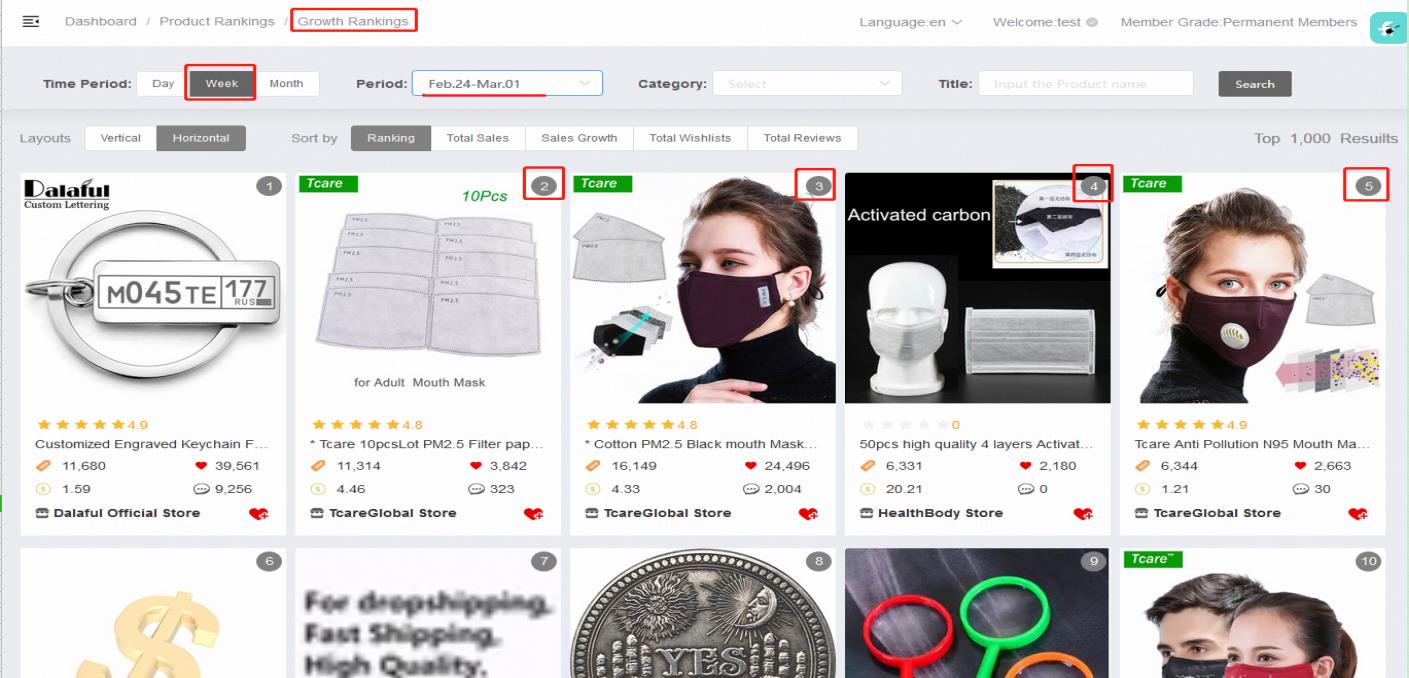
Weekly Growth Rankings
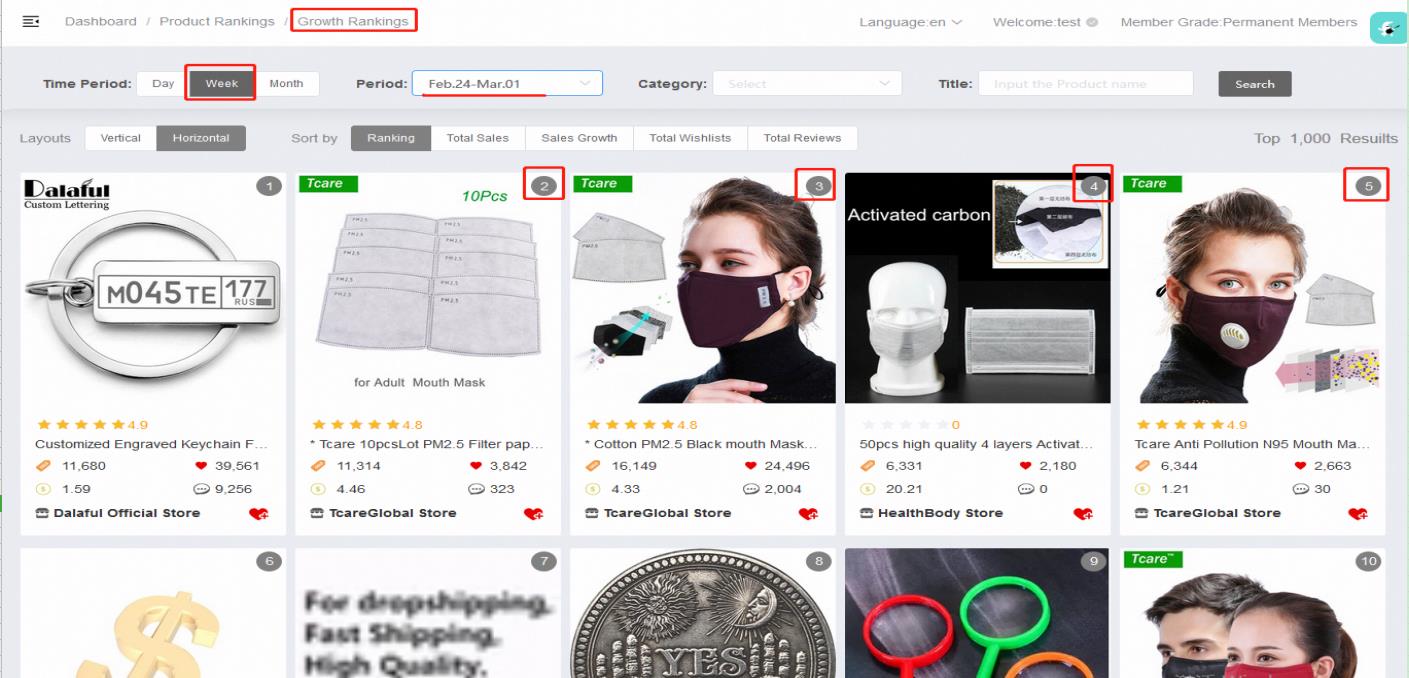
In the weekly growth rankings, there are 4 mouth masks ranking in the top 5 products at the end of February.
Pic: Weekly Growth Rankings (Feb. 2-Mar. 1)
In-depth Statistics in a Period of Time
Let’s see more in-depth statistics to analysis the monthly product trend, including sales volume, wishlists, reviews, price, stars & QTY, related products and buyer show.
Pic: Sales Trend Chart (30 Days)
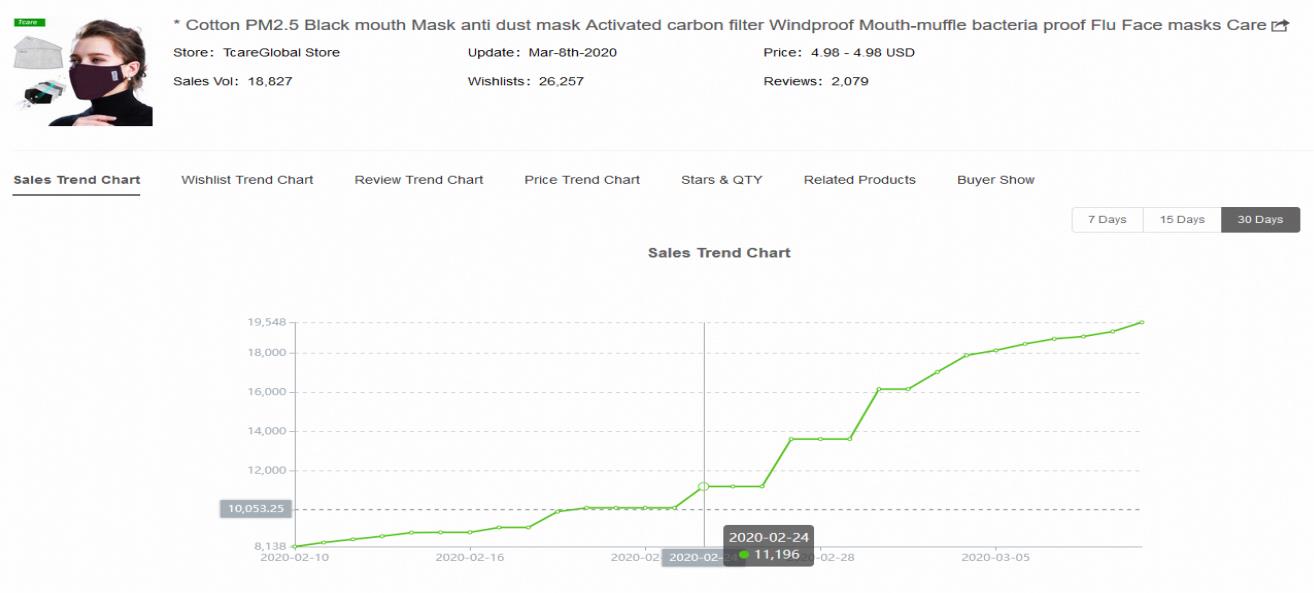
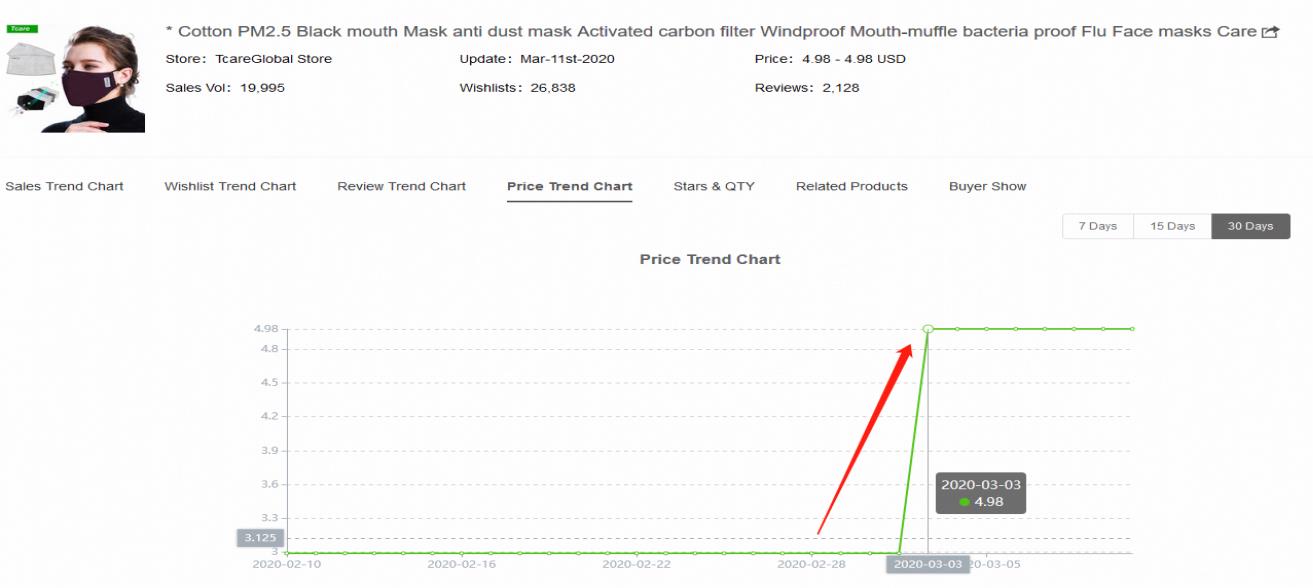
Due to the increasing demand, the supply is becoming insufficient in Early March.
A good-performance seller raised the price (from $3.125 to $4.98, increased by 59%) and extend estimated delivery period (30-50 days).
Pic: Price Trend Chart (30 Days)
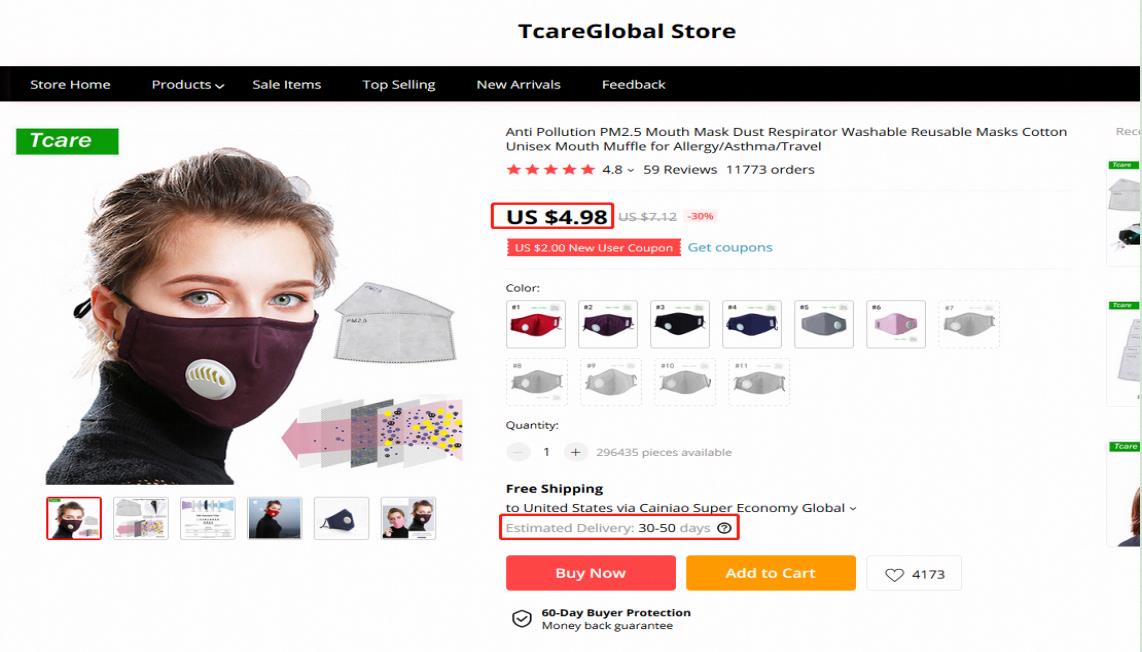
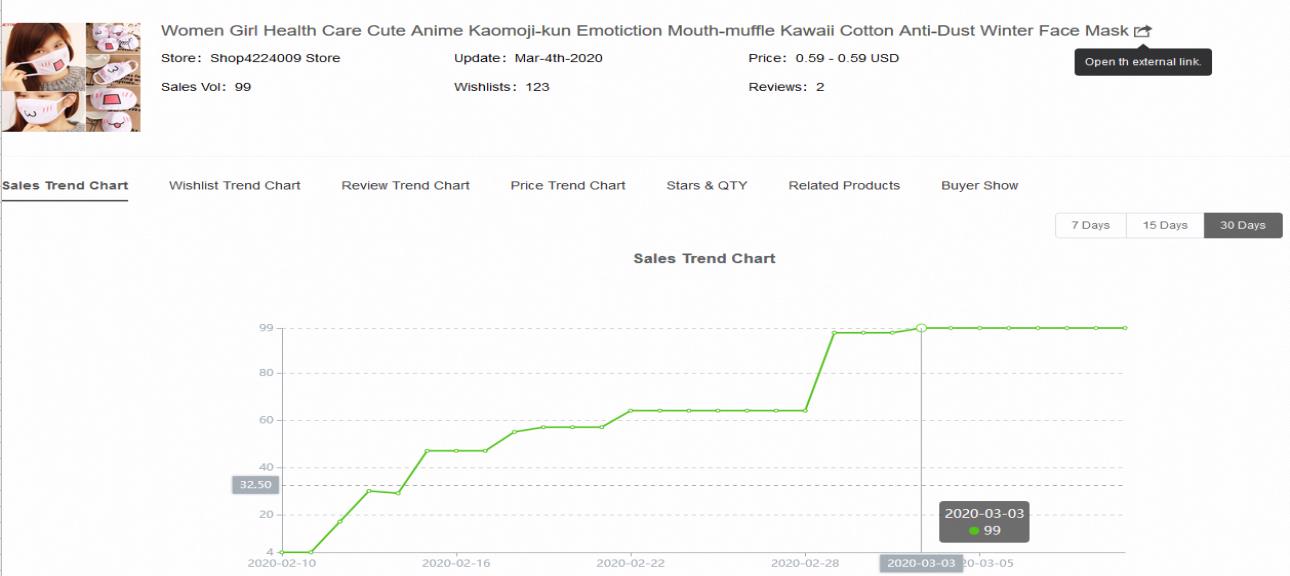
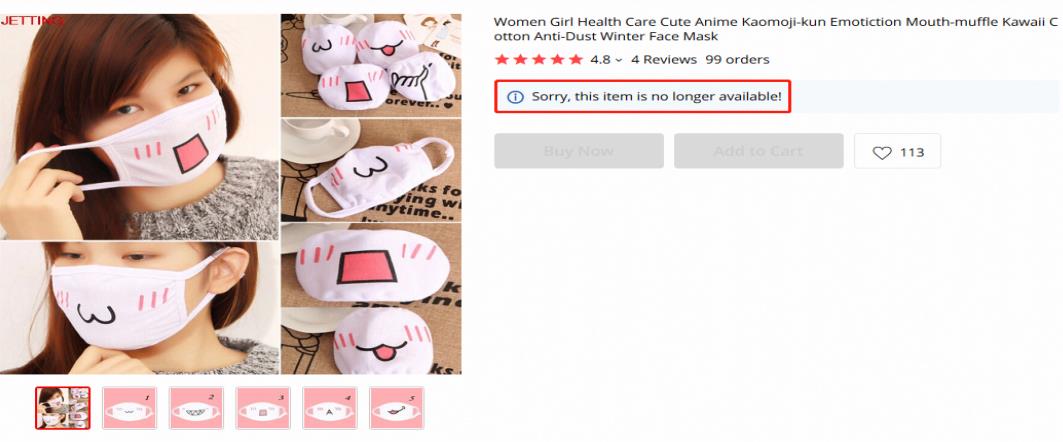
We found a mouth mask stops its sales at the beginning of March, due to a shortage of stock.
Pic: Sales Trend Chart (30 Days)
Summary:
Searching for profitable and potential AliExpress products is not an easy job. IXSPY for AliExpress, a powerful data monitoring and analyzing tool, offers all-round and up-to-date info and helps you yield twice the result with half the effort.
Rigid Demand of Products:
The widespread of COVID-19 greatly stimulates the demands of surgical or household protective products.
Pic: Trend in COVID-19 Cases & Death (China Excluded)

How to Track the Growth Trend of Products?
Hot Rankings of TOP 1, 000 Products (Before & After)
Before: Searching for the keyword 【mouth mask】, you will find only 2 products and these products rank 788th and 870th respectively in January Hot Rankings.
Pic: Monthly Hot Rankings of TOP 1, 000 products in January

After: Within less than one month, 8 mouth masks are ranked in top 1, 000 Hot Rankings after searching for the same keyword, and the previous 788th product soars to the 37th place now.
Pic: Monthly Hot Rankings of TOP 1, 000 products in February

Weekly Growth Rankings
In the weekly growth rankings, there are 4 mouth masks ranking in the top 5 products at the end of February.
Pic: Weekly Growth Rankings (Feb. 2-Mar. 1)

In-depth Statistics in a Period of Time
Let’s see more in-depth statistics to analysis the monthly product trend, including sales volume, wishlists, reviews, price, stars & QTY, related products and buyer show.
Pic: Sales Trend Chart (30 Days)

Due to the increasing demand, the supply is becoming insufficient in Early March.
A good-performance seller raised the price (from $3.125 to $4.98, increased by 59%) and extend estimated delivery period (30-50 days).
Pic: Price Trend Chart (30 Days)


We found a mouth mask stops its sales at the beginning of March, due to a shortage of stock.
Pic: Sales Trend Chart (30 Days)


Summary:
Searching for profitable and potential AliExpress products is not an easy job. IXSPY for AliExpress, a powerful data monitoring and analyzing tool, offers all-round and up-to-date info and helps you yield twice the result with half the effort.

March 18 2020
New Store Grow Lists
Quick Summary
New Store Growth Lists: They are based on daily, weekly & monthly statistics of top 1,000 NEW stores in each AliExpress category .
New Stores: The start date of the store is within 60 days.
Growth Lists are ranked by Growth QTY ( quantity DIFFERENCE).
Benefits
The New store Growth Lists help you discover new business opportunities and enable you to view your chosen stores’ latest and complete statistics, according to your customized options. At a glance you can see if the statistics of the store are increasing or falling, so as to determine if a store is as popular as it once was, and if it is still worth tracking.
How to Use?
Choose the time period (Day, Month or Month) and category, then type the keyword. After that, click on “search” button to find your results below. You can see the ranking of each store in the first column, together with other statistics about the store.
Limits: You can track up to 1,000 NEW stores in each category.
If you choose different filter conditions, the results will be reordered by your chosen conditions. How convenient and thoughtful!

Tips:
Click on a store name or the small black icon next to the heart icon will pop up a detail page, where you can view in-depth statistics about the store.
If you want to monitor the store, please click on the heart icon. And then you will find the store in the list of “My Favorites”.

Sales Growth QTY is the quantity DIFFERENCE of sales volume between the period you choose ( days, weeks or months) and its previous period.
eg: Daily Sales Growth QTY :
Quantity Difference of Sales Volume (Dec. 30) = Sales Volume (Dec. 30) - Sales Volume (Dec. 29)
Who Can Use This?
Please refer to the
New Store Growth Lists: They are based on daily, weekly & monthly statistics of top 1,000 NEW stores in each AliExpress category .
New Stores: The start date of the store is within 60 days.
Growth Lists are ranked by Growth QTY ( quantity DIFFERENCE).
Benefits
The New store Growth Lists help you discover new business opportunities and enable you to view your chosen stores’ latest and complete statistics, according to your customized options. At a glance you can see if the statistics of the store are increasing or falling, so as to determine if a store is as popular as it once was, and if it is still worth tracking.
How to Use?
Choose the time period (Day, Month or Month) and category, then type the keyword. After that, click on “search” button to find your results below. You can see the ranking of each store in the first column, together with other statistics about the store.
Limits: You can track up to 1,000 NEW stores in each category.
If you choose different filter conditions, the results will be reordered by your chosen conditions. How convenient and thoughtful!

Tips:
Click on a store name or the small black icon next to the heart icon will pop up a detail page, where you can view in-depth statistics about the store.
If you want to monitor the store, please click on the heart icon. And then you will find the store in the list of “My Favorites”.

Sales Growth QTY is the quantity DIFFERENCE of sales volume between the period you choose ( days, weeks or months) and its previous period.
eg: Daily Sales Growth QTY :
Quantity Difference of Sales Volume (Dec. 30) = Sales Volume (Dec. 30) - Sales Volume (Dec. 29)
Who Can Use This?
Please refer to the
Member Upgrade page.

March 18 2020
Store Hot Rankings
Quick Summary
Store Hot Rankings: They are based on daily, weekly & monthly statistics of top 1,000 stores in each AliExpress category .
Benefits
The Store Hot Rankings help you discover business opportunities and enable you to view your chosen stores’ latest and complete statistics, according to your customized options. At a glance you can see if the statistics of the store are increasing or falling, so as to determine if a store is as popular as it once was, and if it is still worth tracking.
How to Use?
Choose the time period (Day, Month or Month) and category, then type the keyword. After that, click on “search” button to find your results below.You can see the ranking of each store in the first column, together with other statistics about the store.
Limits: You can track up to 1,000 stores in each category.
If you choose different filter conditions, the results will be reordered by your chosen conditions. How convenient and thoughtful!

Tips:
Click on a store name or the small black icon next to the heart icon will pop up a detail page, where you can view in-depth statistics about the store.
If you want to monitor the store, please click on the heart icon. And then you will find the store in the list of “My Favorites”.

Who Can Use This?
Please refer to the
Store Hot Rankings: They are based on daily, weekly & monthly statistics of top 1,000 stores in each AliExpress category .
Benefits
The Store Hot Rankings help you discover business opportunities and enable you to view your chosen stores’ latest and complete statistics, according to your customized options. At a glance you can see if the statistics of the store are increasing or falling, so as to determine if a store is as popular as it once was, and if it is still worth tracking.
How to Use?
Choose the time period (Day, Month or Month) and category, then type the keyword. After that, click on “search” button to find your results below.You can see the ranking of each store in the first column, together with other statistics about the store.
Limits: You can track up to 1,000 stores in each category.
If you choose different filter conditions, the results will be reordered by your chosen conditions. How convenient and thoughtful!

Tips:
Click on a store name or the small black icon next to the heart icon will pop up a detail page, where you can view in-depth statistics about the store.
If you want to monitor the store, please click on the heart icon. And then you will find the store in the list of “My Favorites”.

Who Can Use This?
Please refer to the
Member Upgrade page.

March 18 2020
New Store Hot Lists
Quick Summary
New Store Hot Rankings: They are based on daily, weekly & monthly statistics of top 1,000 NEW stores in each AliExpress category.
New Stores: The start date of the store is within 60 days.
Benefits
The New Store Hot Rankings help you discover business opportunities and enable you to view your chosen stores’ latest and complete statistics, according to your customized options. At a glance you can see if the statistics of the store are increasing or falling, so as to determine if a store is as popular as it once was, and if it is still worth tracking.
How to Use?
Choose the time period (Day, Month or Month) and category, then type the keyword. After that, click on “search” button to find your results below. You can see the ranking of each store in the first column, together with other statistics about the store.
Limits: You can track up to 1,000 NEW stores in each category.
If you choose different filter conditions, the results will be reordered by your chosen conditions. How convenient and thoughtful!

Tips:
Click on a store name or the small black icon next to the heart icon will pop up a detail page, where you can view in-depth statistics about the store.
If you want to monitor the store, please click on the heart icon. And then you will find the store in the list of “My Favorites”.

Who Can Use This?
Please refer to the
New Store Hot Rankings: They are based on daily, weekly & monthly statistics of top 1,000 NEW stores in each AliExpress category.
New Stores: The start date of the store is within 60 days.
Benefits
The New Store Hot Rankings help you discover business opportunities and enable you to view your chosen stores’ latest and complete statistics, according to your customized options. At a glance you can see if the statistics of the store are increasing or falling, so as to determine if a store is as popular as it once was, and if it is still worth tracking.
How to Use?
Choose the time period (Day, Month or Month) and category, then type the keyword. After that, click on “search” button to find your results below. You can see the ranking of each store in the first column, together with other statistics about the store.
Limits: You can track up to 1,000 NEW stores in each category.
If you choose different filter conditions, the results will be reordered by your chosen conditions. How convenient and thoughtful!

Tips:
Click on a store name or the small black icon next to the heart icon will pop up a detail page, where you can view in-depth statistics about the store.
If you want to monitor the store, please click on the heart icon. And then you will find the store in the list of “My Favorites”.

Who Can Use This?
Please refer to the
Member Upgrade page.

March 18 2020
Store Growth Rankings
Quick Summary
Store Growth Rankings: They are based on daily, weekly & monthly statistics of top 1,000 stores in each AliExpress category .
Growth Rankings are ranked by Growth QTY ( quantity DIFFERENCE).
Benefits
The Store Growth Rankings help you discover business opportunities and enable you to view your chosen stores’ latest and complete statistics, according to your customized options. At a glance you can see if the statistics of the store are increasing or falling, so as to determine if a store is as popular as it once was, and if it is still worth tracking.
How to Use?
Choose the time period (Day, Month or Month) and category, then type the keyword. After that, click on “search” button to find your results below.You can see the ranking of each store in the first column, together with other statistics about the store.
Limits: You can track up to 1,000 stores in each category.
If you choose different filter conditions, the results will be reordered by your chosen conditions. How convenient and thoughtful!

Tips:
Click on a store name or the small black icon next to the heart icon will pop up a detail page, where you can view in-depth statistics about the store.
If you want to monitor the store, please click on the heart icon. And then you will find the store in the list of “My Favorites”.

Sales Growth QTY is the quantity DIFFERENCE of sales volume between the period you choose ( days, weeks or months) and its previous period.
eg: Daily Sales Growth QTY :
Quantity Difference of Sales Volume (Dec. 30) = Sales Volume (Dec. 30) - Sales Volume (Dec. 29)
Who Can Use This?
Please refer to the
Store Growth Rankings: They are based on daily, weekly & monthly statistics of top 1,000 stores in each AliExpress category .
Growth Rankings are ranked by Growth QTY ( quantity DIFFERENCE).
Benefits
The Store Growth Rankings help you discover business opportunities and enable you to view your chosen stores’ latest and complete statistics, according to your customized options. At a glance you can see if the statistics of the store are increasing or falling, so as to determine if a store is as popular as it once was, and if it is still worth tracking.
How to Use?
Choose the time period (Day, Month or Month) and category, then type the keyword. After that, click on “search” button to find your results below.You can see the ranking of each store in the first column, together with other statistics about the store.
Limits: You can track up to 1,000 stores in each category.
If you choose different filter conditions, the results will be reordered by your chosen conditions. How convenient and thoughtful!

Tips:
Click on a store name or the small black icon next to the heart icon will pop up a detail page, where you can view in-depth statistics about the store.
If you want to monitor the store, please click on the heart icon. And then you will find the store in the list of “My Favorites”.

Sales Growth QTY is the quantity DIFFERENCE of sales volume between the period you choose ( days, weeks or months) and its previous period.
eg: Daily Sales Growth QTY :
Quantity Difference of Sales Volume (Dec. 30) = Sales Volume (Dec. 30) - Sales Volume (Dec. 29)
Who Can Use This?
Please refer to the
Member Upgrade page.
RECENT POSTS
- IXSPY速卖通选品工具介绍
- Research |5 Best Winning Products In December-Dropshipping| Facebook Ad Products Trends
- Sell It Now|5 Best Winning Products In December-Dropshipping| Facebook Ad Trending Products Research
- Sell it Now | 5 Best Selling Winning Products To Dropship In November- Trending Shopify Research
- AliExpress Research | 5 Best Winning Products In November- Sell Right Now- Dropshipping/Shpify