

March 18 2020
Product Total Rankings
Quick Summary
Product Total Rankings display the information based on ACCUMULATED statistics of top 1,000 products in each AliExpress category.
Benefits
The Product Total Rankings help you discover new business opportunities and enable you to view your chosen products' latest and complete statistics, according to your customized options. At a glance you can see if the statistics of the product are increasing or falling, so as to determine if a product is as popular as it once was, and if it is still worth tracking.
How to Use?
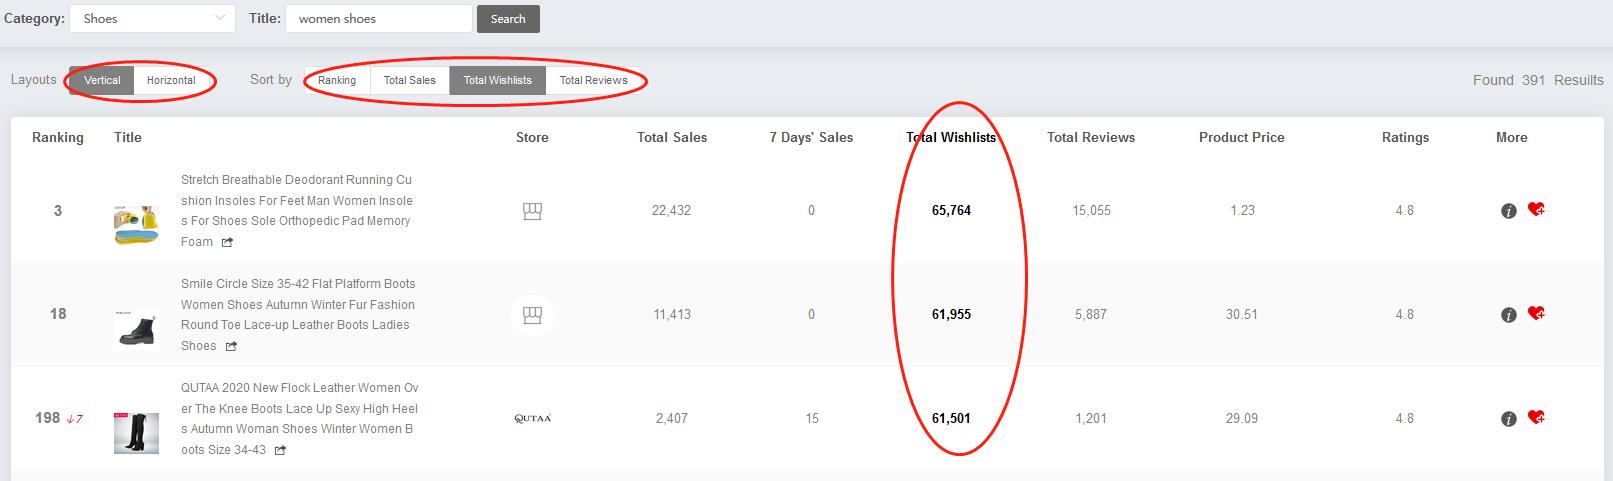
Choose the category and type any word or phrase contained in your titles. After that, click on “search” button to find your results below. You can see the ranking and other statistics of each product.
Limits: You can track up to 1,000 products in each category.
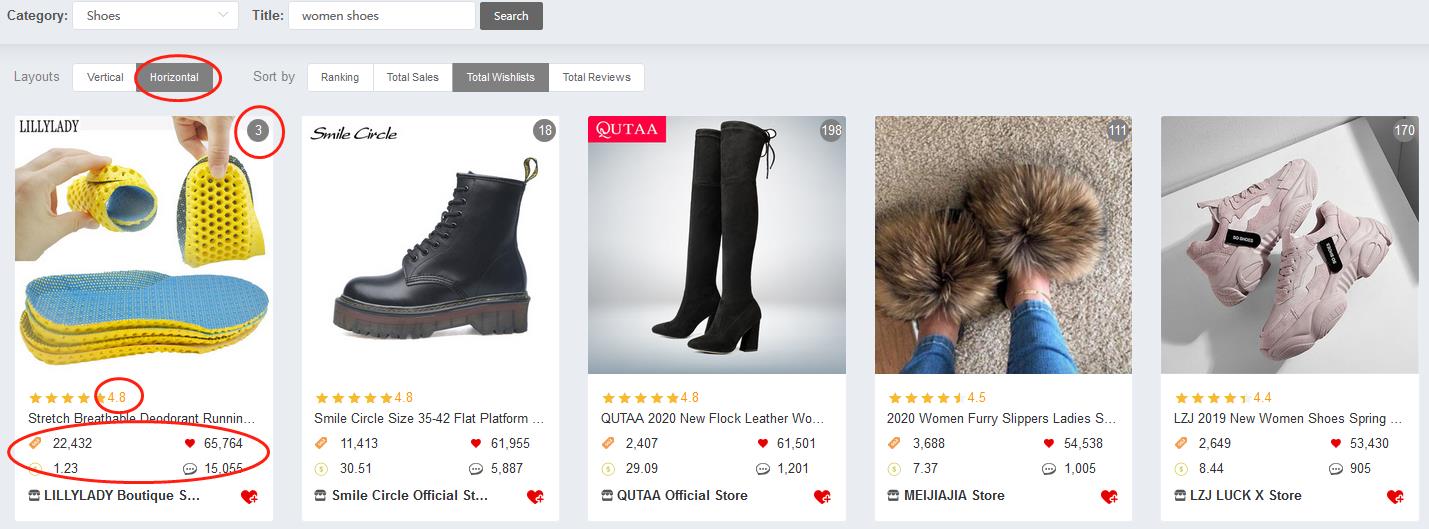
Searching results are shown in two layouts (horizontal or vertical) for your selection.
If you choose different filter conditions, the results will be reordered by your chosen conditions. How convenient and thoughtful!
Tips:
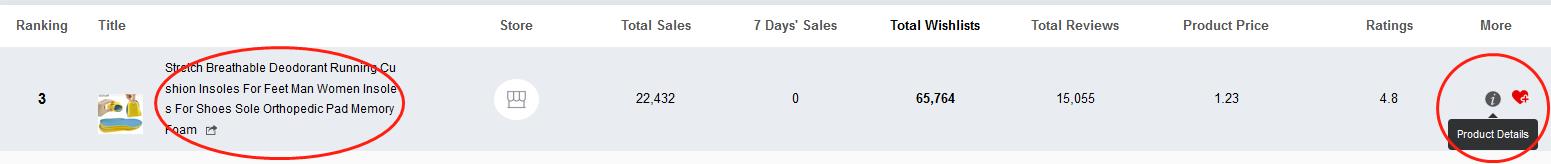
Vertical Layout: Click on a product name or the small black icon next to the heart icon will pop up a detail page, where you can view in-depth statistics about the product.
Horizontal Layout: Click on a product name or the photo will pop up a detail page, where you can view in-depth statistics about the product.
If you want to monitor the product, please click on the heart icon. And then you will find the product in the list of “My Favorites”.

Who Can Use This?
Please refer to the
Product Total Rankings display the information based on ACCUMULATED statistics of top 1,000 products in each AliExpress category.
Benefits
The Product Total Rankings help you discover new business opportunities and enable you to view your chosen products' latest and complete statistics, according to your customized options. At a glance you can see if the statistics of the product are increasing or falling, so as to determine if a product is as popular as it once was, and if it is still worth tracking.
How to Use?
Choose the category and type any word or phrase contained in your titles. After that, click on “search” button to find your results below. You can see the ranking and other statistics of each product.
Limits: You can track up to 1,000 products in each category.
Searching results are shown in two layouts (horizontal or vertical) for your selection.
If you choose different filter conditions, the results will be reordered by your chosen conditions. How convenient and thoughtful!
Tips:
Vertical Layout: Click on a product name or the small black icon next to the heart icon will pop up a detail page, where you can view in-depth statistics about the product.
Horizontal Layout: Click on a product name or the photo will pop up a detail page, where you can view in-depth statistics about the product.
If you want to monitor the product, please click on the heart icon. And then you will find the product in the list of “My Favorites”.
Who Can Use This?
Please refer to the
Member Upgrade page.

March 18 2020
Store Search
Quick Summary
Store Search displays more and detailed information of all the AliExpress stores.
Benefits
The Store Search help you discover new business opportunities and enable you to view your chosen stores’ latest and complete statistics, according to your customized options. At a glance you can see if the statistics of the store are increasing or falling, so as to determine if a store is as popular as it once was, and if it is still worth tracking.
How to Use?
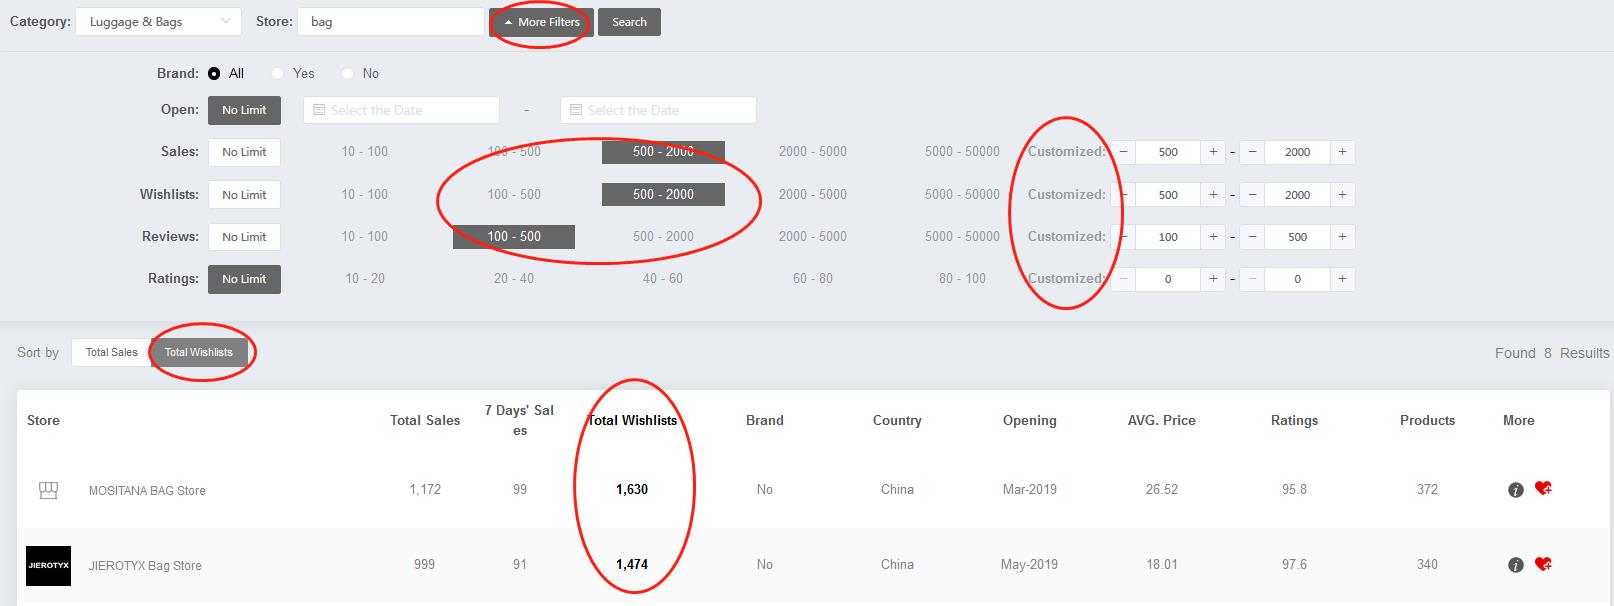
Choose the category and type the keyword. Or click on the button of “more filters” to add more conditions or customized options, if necessary. After that, click on “search” button to find your results below. You can see some important statistics of each store.
If you choose different filter conditions, the results will be reordered by your chosen conditions. How convenient and thoughtful!
Tips:
Click on a store name or the small black icon next to the heart icon will pop up a detail page, where you can view in-depth statistics about the store.
If you want to monitor the store, please click on the heart icon. And then you will find the store in the list of “My Favorites”.

Who Can Use This?
Please refer to the
Store Search displays more and detailed information of all the AliExpress stores.
Benefits
The Store Search help you discover new business opportunities and enable you to view your chosen stores’ latest and complete statistics, according to your customized options. At a glance you can see if the statistics of the store are increasing or falling, so as to determine if a store is as popular as it once was, and if it is still worth tracking.
How to Use?
Choose the category and type the keyword. Or click on the button of “more filters” to add more conditions or customized options, if necessary. After that, click on “search” button to find your results below. You can see some important statistics of each store.
If you choose different filter conditions, the results will be reordered by your chosen conditions. How convenient and thoughtful!
Tips:
Click on a store name or the small black icon next to the heart icon will pop up a detail page, where you can view in-depth statistics about the store.
If you want to monitor the store, please click on the heart icon. And then you will find the store in the list of “My Favorites”.
Who Can Use This?
Please refer to the
Member Upgrade page.
March 18 2020
New Store Grow Lists
Quick Summary
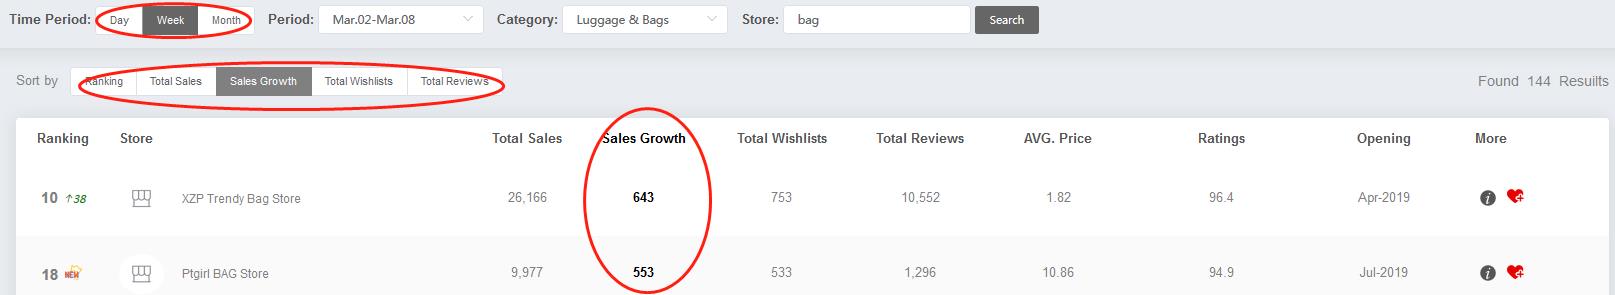
New Store Growth Lists: They are based on daily, weekly & monthly statistics of top 1,000 NEW stores in each AliExpress category .
New Stores: The start date of the store is within 60 days.
Growth Lists are ranked by Growth QTY ( quantity DIFFERENCE).
Benefits
The New store Growth Lists help you discover new business opportunities and enable you to view your chosen stores’ latest and complete statistics, according to your customized options. At a glance you can see if the statistics of the store are increasing or falling, so as to determine if a store is as popular as it once was, and if it is still worth tracking.
How to Use?
Choose the time period (Day, Month or Month) and category, then type the keyword. After that, click on “search” button to find your results below. You can see the ranking of each store in the first column, together with other statistics about the store.
Limits: You can track up to 1,000 NEW stores in each category.
If you choose different filter conditions, the results will be reordered by your chosen conditions. How convenient and thoughtful!

Tips:
Click on a store name or the small black icon next to the heart icon will pop up a detail page, where you can view in-depth statistics about the store.
If you want to monitor the store, please click on the heart icon. And then you will find the store in the list of “My Favorites”.

Sales Growth QTY is the quantity DIFFERENCE of sales volume between the period you choose ( days, weeks or months) and its previous period.
eg: Daily Sales Growth QTY :
Quantity Difference of Sales Volume (Dec. 30) = Sales Volume (Dec. 30) - Sales Volume (Dec. 29)
Who Can Use This?
Please refer to the
New Store Growth Lists: They are based on daily, weekly & monthly statistics of top 1,000 NEW stores in each AliExpress category .
New Stores: The start date of the store is within 60 days.
Growth Lists are ranked by Growth QTY ( quantity DIFFERENCE).
Benefits
The New store Growth Lists help you discover new business opportunities and enable you to view your chosen stores’ latest and complete statistics, according to your customized options. At a glance you can see if the statistics of the store are increasing or falling, so as to determine if a store is as popular as it once was, and if it is still worth tracking.
How to Use?
Choose the time period (Day, Month or Month) and category, then type the keyword. After that, click on “search” button to find your results below. You can see the ranking of each store in the first column, together with other statistics about the store.
Limits: You can track up to 1,000 NEW stores in each category.
If you choose different filter conditions, the results will be reordered by your chosen conditions. How convenient and thoughtful!
Tips:
Click on a store name or the small black icon next to the heart icon will pop up a detail page, where you can view in-depth statistics about the store.
If you want to monitor the store, please click on the heart icon. And then you will find the store in the list of “My Favorites”.
Sales Growth QTY is the quantity DIFFERENCE of sales volume between the period you choose ( days, weeks or months) and its previous period.
eg: Daily Sales Growth QTY :
Quantity Difference of Sales Volume (Dec. 30) = Sales Volume (Dec. 30) - Sales Volume (Dec. 29)
Who Can Use This?
Please refer to the
Member Upgrade page.
March 18 2020
New Store Hot Lists
Quick Summary
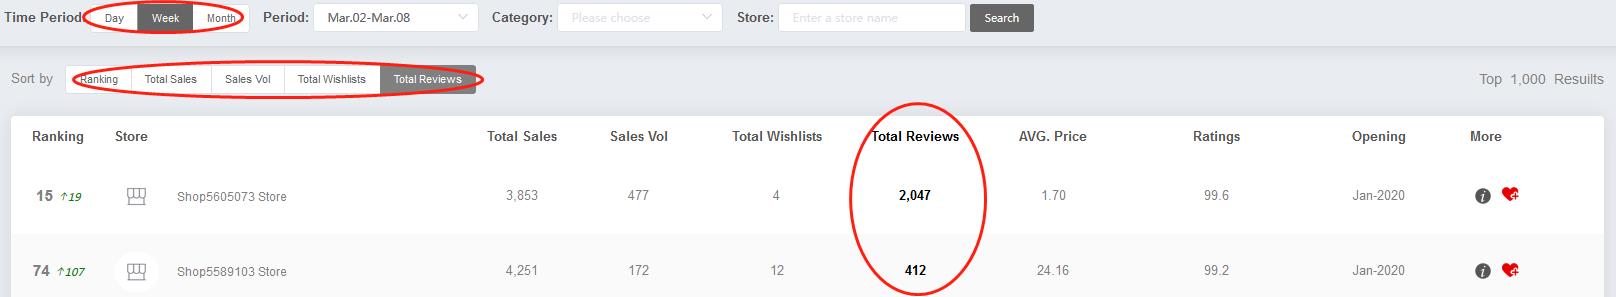
New Store Hot Rankings: They are based on daily, weekly & monthly statistics of top 1,000 NEW stores in each AliExpress category.
New Stores: The start date of the store is within 60 days.
Benefits
The New Store Hot Rankings help you discover business opportunities and enable you to view your chosen stores’ latest and complete statistics, according to your customized options. At a glance you can see if the statistics of the store are increasing or falling, so as to determine if a store is as popular as it once was, and if it is still worth tracking.
How to Use?
Choose the time period (Day, Month or Month) and category, then type the keyword. After that, click on “search” button to find your results below. You can see the ranking of each store in the first column, together with other statistics about the store.
Limits: You can track up to 1,000 NEW stores in each category.
If you choose different filter conditions, the results will be reordered by your chosen conditions. How convenient and thoughtful!

Tips:
Click on a store name or the small black icon next to the heart icon will pop up a detail page, where you can view in-depth statistics about the store.
If you want to monitor the store, please click on the heart icon. And then you will find the store in the list of “My Favorites”.

Who Can Use This?
Please refer to the
New Store Hot Rankings: They are based on daily, weekly & monthly statistics of top 1,000 NEW stores in each AliExpress category.
New Stores: The start date of the store is within 60 days.
Benefits
The New Store Hot Rankings help you discover business opportunities and enable you to view your chosen stores’ latest and complete statistics, according to your customized options. At a glance you can see if the statistics of the store are increasing or falling, so as to determine if a store is as popular as it once was, and if it is still worth tracking.
How to Use?
Choose the time period (Day, Month or Month) and category, then type the keyword. After that, click on “search” button to find your results below. You can see the ranking of each store in the first column, together with other statistics about the store.
Limits: You can track up to 1,000 NEW stores in each category.
If you choose different filter conditions, the results will be reordered by your chosen conditions. How convenient and thoughtful!
Tips:
Click on a store name or the small black icon next to the heart icon will pop up a detail page, where you can view in-depth statistics about the store.
If you want to monitor the store, please click on the heart icon. And then you will find the store in the list of “My Favorites”.
Who Can Use This?
Please refer to the
Member Upgrade page.
March 18 2020
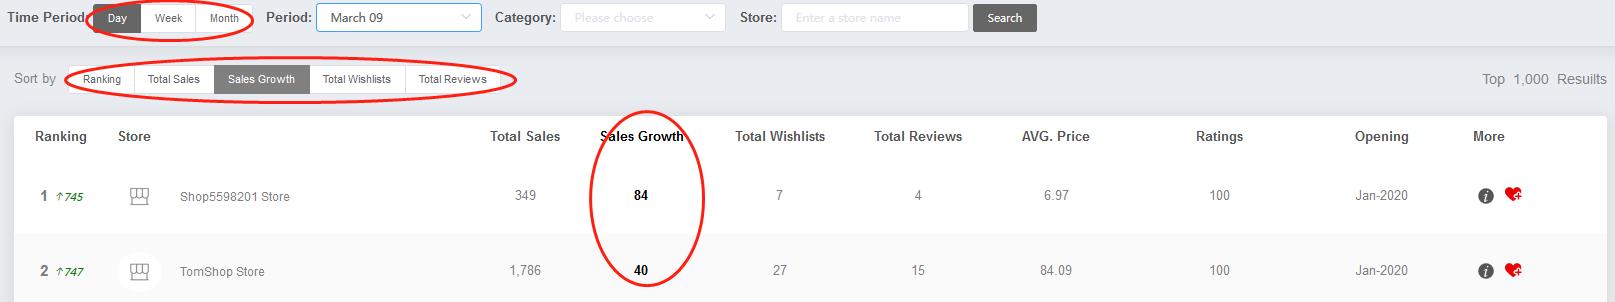
Store Growth Rankings
Quick Summary
Store Growth Rankings: They are based on daily, weekly & monthly statistics of top 1,000 stores in each AliExpress category .
Growth Rankings are ranked by Growth QTY ( quantity DIFFERENCE).
Benefits
The Store Growth Rankings help you discover business opportunities and enable you to view your chosen stores’ latest and complete statistics, according to your customized options. At a glance you can see if the statistics of the store are increasing or falling, so as to determine if a store is as popular as it once was, and if it is still worth tracking.
How to Use?
Choose the time period (Day, Month or Month) and category, then type the keyword. After that, click on “search” button to find your results below.You can see the ranking of each store in the first column, together with other statistics about the store.
Limits: You can track up to 1,000 stores in each category.
If you choose different filter conditions, the results will be reordered by your chosen conditions. How convenient and thoughtful!

Tips:
Click on a store name or the small black icon next to the heart icon will pop up a detail page, where you can view in-depth statistics about the store.
If you want to monitor the store, please click on the heart icon. And then you will find the store in the list of “My Favorites”.

Sales Growth QTY is the quantity DIFFERENCE of sales volume between the period you choose ( days, weeks or months) and its previous period.
eg: Daily Sales Growth QTY :
Quantity Difference of Sales Volume (Dec. 30) = Sales Volume (Dec. 30) - Sales Volume (Dec. 29)
Who Can Use This?
Please refer to the
Store Growth Rankings: They are based on daily, weekly & monthly statistics of top 1,000 stores in each AliExpress category .
Growth Rankings are ranked by Growth QTY ( quantity DIFFERENCE).
Benefits
The Store Growth Rankings help you discover business opportunities and enable you to view your chosen stores’ latest and complete statistics, according to your customized options. At a glance you can see if the statistics of the store are increasing or falling, so as to determine if a store is as popular as it once was, and if it is still worth tracking.
How to Use?
Choose the time period (Day, Month or Month) and category, then type the keyword. After that, click on “search” button to find your results below.You can see the ranking of each store in the first column, together with other statistics about the store.
Limits: You can track up to 1,000 stores in each category.
If you choose different filter conditions, the results will be reordered by your chosen conditions. How convenient and thoughtful!
Tips:
Click on a store name or the small black icon next to the heart icon will pop up a detail page, where you can view in-depth statistics about the store.
If you want to monitor the store, please click on the heart icon. And then you will find the store in the list of “My Favorites”.
Sales Growth QTY is the quantity DIFFERENCE of sales volume between the period you choose ( days, weeks or months) and its previous period.
eg: Daily Sales Growth QTY :
Quantity Difference of Sales Volume (Dec. 30) = Sales Volume (Dec. 30) - Sales Volume (Dec. 29)
Who Can Use This?
Please refer to the